


Audience: This article is intended for those who are familiar with the fundamentals of Python.
We live in an information-rich world. Because of the strong desire to exploit data, data science positions are always in demand making employment opportunities in the field quite accessible. In this article, I'll walk you through the fundamentals of data science.
What exactly is data science?
 Data science is a field of study that includes modern tools and methods for extracting, processing, and analyzing data. These tools may only be provided by libraries used in programming languages such as Python, JavaScript, and R programming. However, Python will be the focus of this article.
What is a module?
A module is a library that groups together similar tools. Numpy, Pandas, Matplotlib, Seaborn, and other modules fall into this category. Learn more about modules here.
What is pandas?
The Pandas module allows you to work with tabular data. Data in a tabular format is divided into rows and columns. Pandas is a popular library because it performs a wide range of data science functions. Learn how to set up Pandas here.
Uses of pandas
Pandas engage in the following activities:
- Load tabular data from different sources.
- Look for a particular column or row.
- Compute total statistics.
- Combines data from various sources
DataFrames
Definition:
A dataframe is a variable that has tabular data. A dataframe can be filled with data by using comma-separated values (csv) file.
How to load a csv file into a dataframe
- Import pandas
import pandas as pd - Read and save the file into a dataframe using the read_csv() function as shown below.
name_of_dataframe = pd.read_csv("name.csv")
Inspecting a dataframe
A dataframe can be examined in a number of ways.
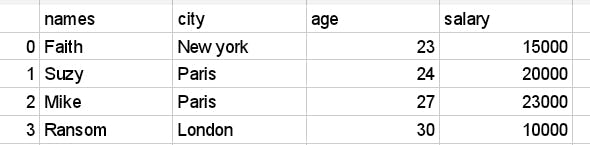
- Using the head method.head() returns the first few rows of the dataframe.
Syntax: name_of_dataframe.head( )
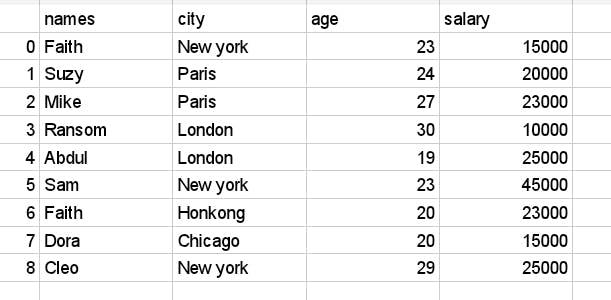
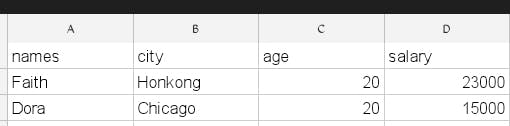
look at the dataframe below, for employee_info.
 Printing the dataframe's head results in
 - Using the info method .info()
syntax: name_of_dataframe.info()
It returns information about the dataframe, including the number of rows and columns, and the data type of each value.
- Using the describe method.describe()
syntax: name_of_dataframe.describe()
It shows the description of a dataframe.
- Using the shape attribute .shape
syntax: name_of_dataframe.shape
Parentheses are not used because, shape is an attribute. It returns the total number of columns and rows in a dataframe.
For example, the employee_info dataframe has 9 rows and 4 columns.
Selecting columns in a dataframe
Why do we select columns?
- In order to compute
- For data visualization
There are several ways to select columns in a dataframe, but we'll look at two for now
- Using square brackets([ ])
we select a column as follows
name_of_dataframe[‘name of column’]
for example employee_info['names'] image
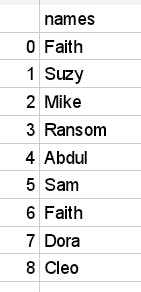 This method is used when the column name contains letters or special characters such as -,? etc.
- Selecting with a dot (.)
We use this technique when the column name contains only letters, strings, or underscores. It can be used in the following ways.
syntax: name_of_dataframe. column name
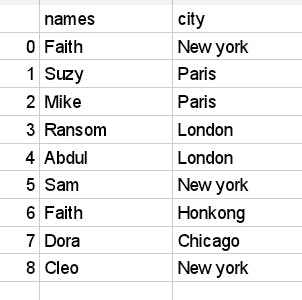
- Selecting multiple columns
Syntax: name_of_dataframe[[‘name of column1’ , ’ name of column2’]]
Example: Employee_info[ [‘names’,’ city ’] ]
- Selecting rows in a dataframe To select rows from a dataframe, logic statements such as ==,>, and so on are used.
Syntax: name_of_dataframe[name_of_dataframe[‘column name’] logical statement value]
Consider the employee information dataframe from earlier. Let's select the rows from the employee_info table where the age is 20.
employee info [employee info['age']==20]
Output
Creating plots
- Creating line plots
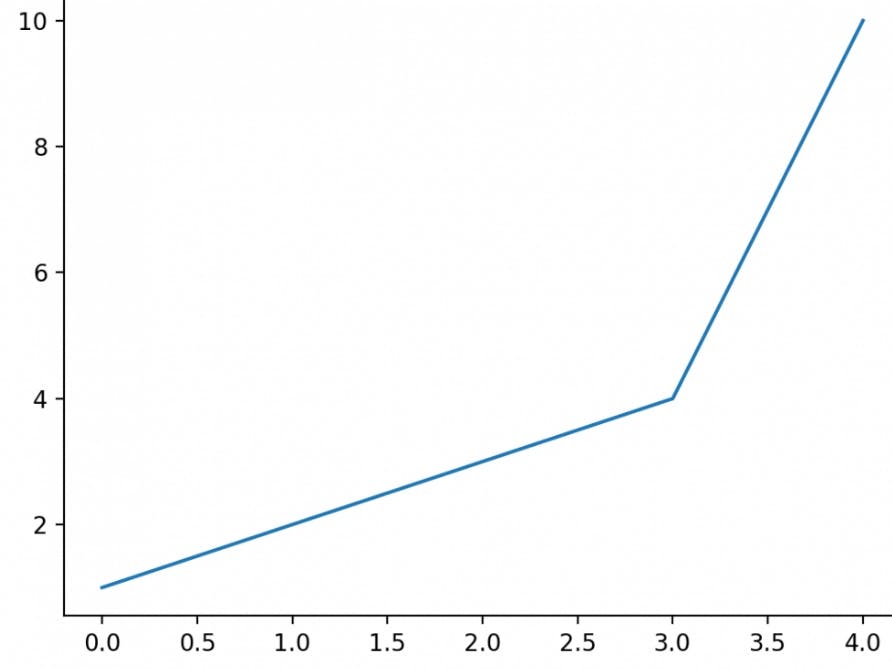
To create a line plot, we must do the following.
- From matplotlib import pyplot
import matplotlib.pyplot as plt - Use the plot() function to plot x and y values on your graph
plt.plot (x-values, y-values)

Where x-values and y-values are the column names containing the values.
- Use the show() function to see how the plot looks.
plt.show()
- Creating scatter plots
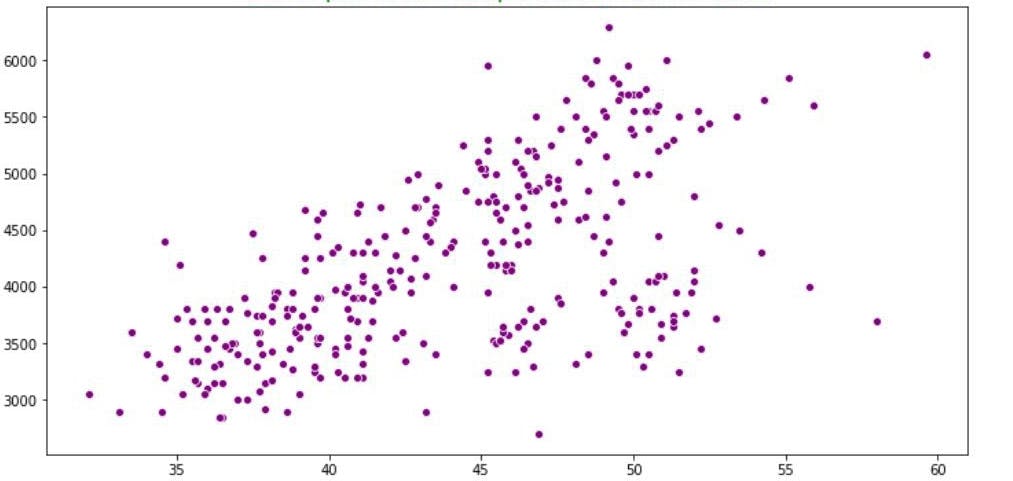
A scatter plot illustrates how each data point appears on a graph. A scattered plot is an excellent way to view unordered plots.
Creating a scattered plot is like creating a line plot. The only difference is that we use the scatter() function instead of the plot() function, as shown below.
plt.scatter (x-values, y-values)
Adding texts to plots
Adding x -axis label
To add an x-axis label, we use the.xlabel() method.
plt.xlabel("x label name")
Adding y-axis labels
We use the.ylabel() method for this.
plt.ylabel("y label name")
Adding titles
We use the.title() method to add titles.
plt.title("plot title name")
Conclusion
Part two of this article will be posted in a few days. I hope this article has been useful in launching your data science career. Please react, comment, and follow for more information. Corrections are always welcome.